First project#
We will run our first program in this section.
Setting the default project folder#
Rider creates new projects under RiderProjects in your home folder as default. I recommend changing the default folder to a subfolder in your course-related folder, e.g., 25fall/indprog/coding-projects.
Tip
Do not create projects in a iCloud synchronized folder on a Mac. This may lead to compiling errors which change every time you compile your project and also slow compiling times. Alternatively keep your projects available locally.
On the welcome screen, click on
Configureon the bottom left corner, thenSettings. Settings window should pop up.Search for
default project dir. The setting is underAppearance & Behavior->System Settings->Default project directory.Click on the folder icon to change it.
Click on
Save. Settings will be closed.
Creating a project#
On the welcome screen, click on

New Solution. A new window will pop up withProject TypeasConsole.
We will use console applications for learning fundamental programming concepts, because a console application has less complexity compared to a graphical user interface (GUI). Later we will also create GUIs.
If this is your first project, you have to install the .NET framework first. Click on
Install. After the installation you should see additional options. Leave them as they are.We will create an online currency converter. Write into the
Solution name:FirstProject. Project name will be automatically the same.Activate:
Put solution and project in the same directoryCreate Git repository
Click on
Create. The editor window will show up withProgram.cs.If a pop up window with
IDE project settings can be added to Gitshows up, clickDon't ask again.If the
What's new ...tab shows up, you can close it.
We will introduce Git later.
Running a program with debugging features#
We will introduce the term debugging later.
Press F5 or
 icon on the top right.
This step will start the compiler which translates the code to a format that can be executed by our computer. It will be run with debugging features, which we will talk about in a bit. In the end a console window with
Hello, World!message will pop up in theConsoletab at the bottom of your screen.
- compiler
a computer program that translates program code written in one programming language into another
Our program has finished running at this point.
Debugging a program#
When our programs get more complicated, debugging will be very useful to find the bugs. In debugging mode, the code will pause at the program line where the first error happened at will give us the opportunity, e.g., which values the variables have to inspect the crime scene like a detective 🕵️.
To learn how debugging works, copy the following code and replace Program.cs on your editor:
1Console.WriteLine("Before");
2int[] numbers = [1, 2, 3];
3Console.WriteLine(numbers[5]);
4Console.WriteLine("After");
Press F5. It may take some time if its the first time.
Then the editor will open a new file
ThrowHelpers.csand stop at the linethrow new IndexOutOfRangeException().
This line is where our program has stopped according to the debugger. This is not very helpful for us, because the file does not seem to be written by us. We will for now configure Rider to not jump into external files that we don’t know about (but stay in our file).
Click on Gear icon on the top right corner → Settings.
Search for the
enable external sourceoption on the top. It will be found underDebuggersettings.Deactivate it. Click on
Save. This will close the settings window.
Now we can start debugging again using F5.
The program should stop at third line. The IDE is in debugging mode and will show you actions like
 (resume program),
  (stop debugging).
The IDE should show you the error cause
Index was outside the bounds of the array..How can this happen? Let us overlook for a moment that we initialized the array with three elements for the sake of demonstrating the debugger. An idea is that we check the content of the array
numbers, exactly at the time when the error happened.This is a superpower of a debugger: we can pause our program and inspect contents of data structures, or computer memory in general. In this case, our program was automatically paused by the debugger.
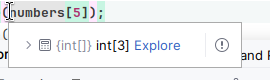
Fig. 1 When we hover our mouse over a data structure in debugging mode, we can see information about its contents. When we click on the > symbol, we can further expand and see actual contents. ::#
Hover your mouse over
numberson the editor, you see first the size of the array as in Fig. 1 and if you expand using the > symbol, you see its contents.We see that the array has three elements with indexes 0, 1, and 2. However we used the index 5 which does not exist. We can fix our code by adding more elements to the array or using an index of an existing element, e.g., 2.
Stop debugging by using ShiftF5 or
.Change the index from 5 to 2 and restart the debugger by pressing F5.
You will see that our program runs and exists without any errors.
Running a program without debugging features#
There is a second option to start our program – without debugging.
On the left of the
button, you will see another play button ▷, which runs the program without debugging features.
Our program will start faster and execute probably also faster in this mode, because debugging features also affect performance.
We don’t care about performance for now and can simply use F5 for starting our program. When we start a typical program on our operating system, it is started without debugging features.
Wrap-up#
You created your first program and used the debugger. We will create a new project in the next section.